Fly.io, Uptime Kuma & scraping a status page
2 Feb 2024
I’ve been aware since I set up Uptime Kuma for my monitoring, that having an instance on my local network monitoring my VPS websites wasn’t ideal. The main reason being that the flakiest part of my infrastructure is my 4G home internet, so if that goes down I have no website monitoring, and even if I did, the notifications couldn’t get out.
Of course, it would also be a simple matter to run an instance on the VPS that I host the sites on, but that has a similar problem in that if the VPS goes down, so does my monitoring of the VPS. What I really need is a third, independent space to run an instance.
Uptime Robot
Uptime Robot is a monitoring service that seems somehow related to Uptime Kuma? They have some of the same terminology and colour schemes - so I’m not really sure. Perhaps it’s a fork, or perhaps Uptime Kuma was inspired by Robot. Robot does have an API which is a nice addition, since ideally if my monitoring is spread around, I’d like to pull it all back into one ‘pane of glass’ by having my system monitor the remote for how many ‘down’ sites it’s tracking. It also has a number of other extra features such as heartbeat monitoring.
Uptime Robot is a paid service, but like nearly all VC funded things growing a user base it has a free tier with some restrictions. I like NTFY for my notifications, but on Robot I could only access email notifications. There are iOS and Android apps, but I didn’t try them.
Third Space
Ideally, I like to run another Uptime Kuma in a VPS on a different provider. I’ve heard that Oracle have a free tier which seems like it would be fine for this application, but a more interesting idea that I’ve been thinking of using for other projects is Fly.io.
Fly.io
Fly.io own physical servers in colo datacentres around the world on which they offer compute based on Firecracker VM’s . The cute bit is that you give them a Docker container, and they unpack it into one of these fast baby VM’s.
The exact nature of their ‘free tier’ is hard to figure out from their pricing page , but based on some answers to questions in their forum , and blog posts from others who have set up Uptime Kuma there, it sounds like the deal is that if you use one shared CPU and keep your storage under 3GB and the charges for your use add up to less than $5/month - then it’s free. I did have to provide credit card details, so if I get a $71,393 bill, I’ll come back here and edit this. (edit from the future: eight months later I haven’t paid a cent).
To get Uptime Kuma running on Fly.io, I followed this guide , but the steps where basically:
- Create an account on Fly.io
- Install the Fly.io command line tools and run a command to ‘create’ your app
- Create a ‘fly.toml ’ file which is a text config file pointing to the docker image and supplying some details such as ports and location
- Use the CLI to set the disk space needed, and ‘deploy’ the app
It was impressive how simple all this was. If the intention of the free tier is to get you to try it, and show you how painless it is to deploy any dockerised app to the edge, then mission accomplished.
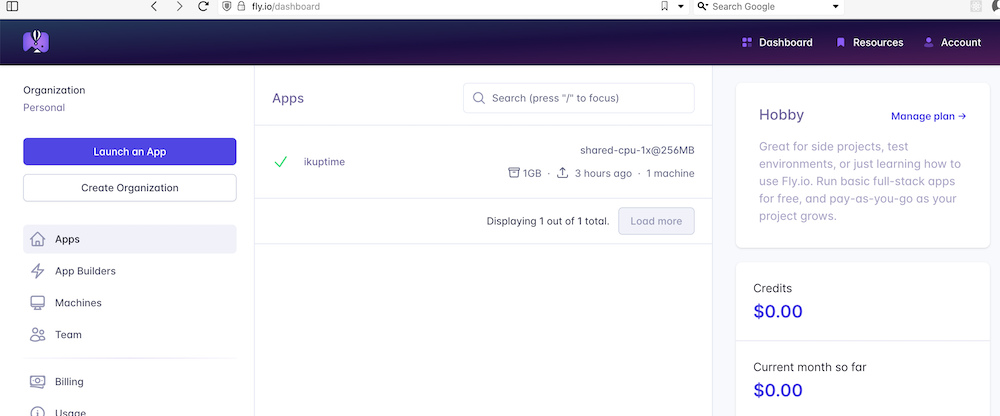
You can check on the status of your app at https://fly.io/dashboard
And go to
It is remarkable what you can deploy for free in the golden age of venture capital.
Extracting Status
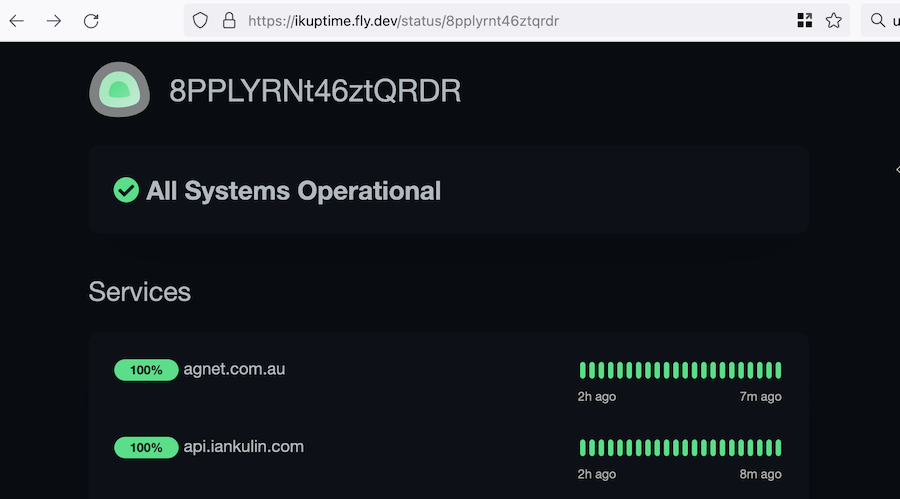
One of Uptime Kuma’s functions is to provide public (ie viewable without being logged in) ‘status’ pages, and if all the services you’ve added to that status group are up, it has. great big heading saying “All Systems Operational”.
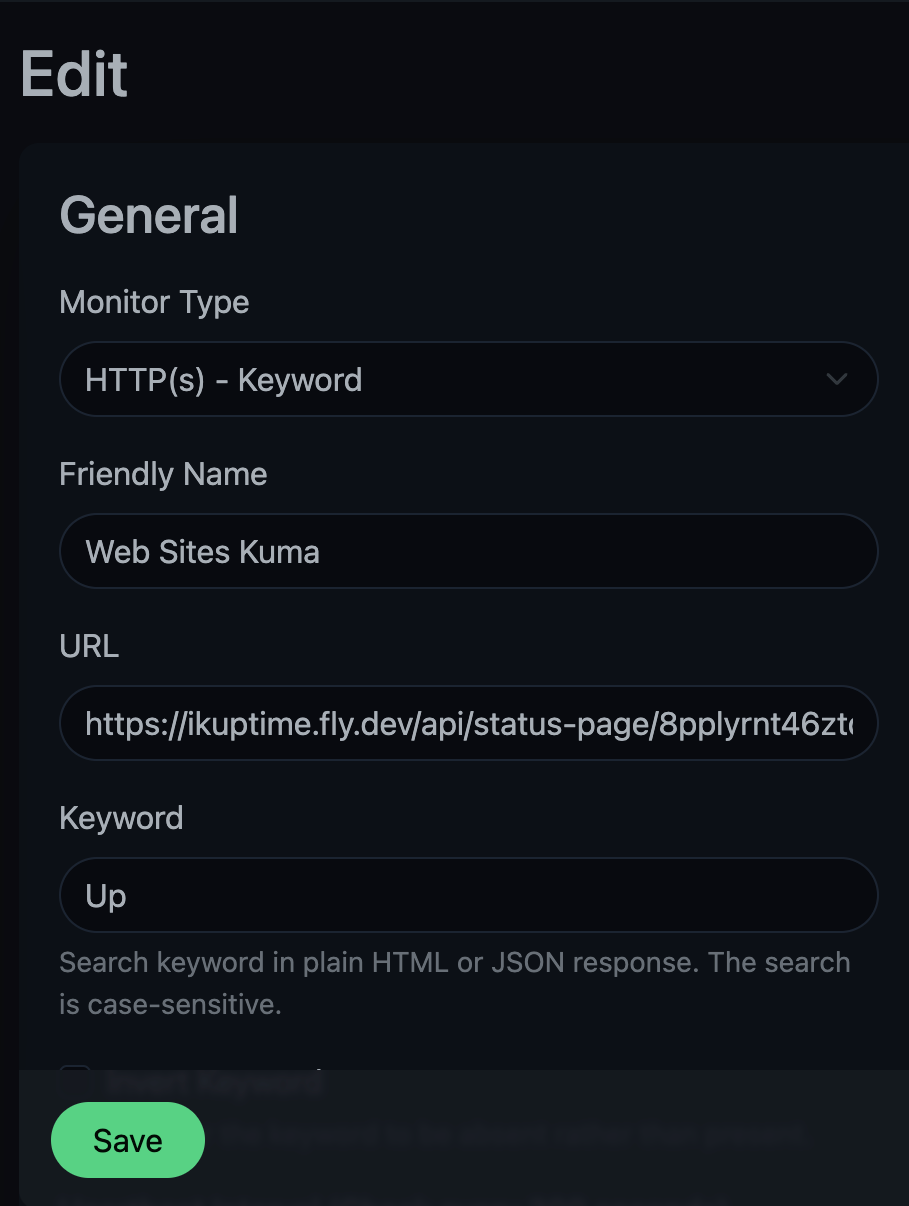
So my plan to pull this status into my homelab instance of Uptime Kuma was just to add this remote status page as a monitor, and search for the keyword ‘All Systems Operational’. If that was found, I’d know everything was good. But of course, this is a modern web-app (I think using Vue ), so that text does not exist in the page, it’s added to the DOM by some JavaScript after the page is loaded based on some client side processing of (probably) some JSON data it pulls in.
One option would be to use a web scraping library to write something to access this piece of information. On a page like this, that would involve a headless browser rendering the DOM then exposing it.
But of course, the Javascript that is building the page we’re looking at is getting its data from somewhere, so it’s probably easier for us to grab that data directly and process it ourselves. How do we see where the data is from? We use the browser tools to look at the network requests when the page is loaded.
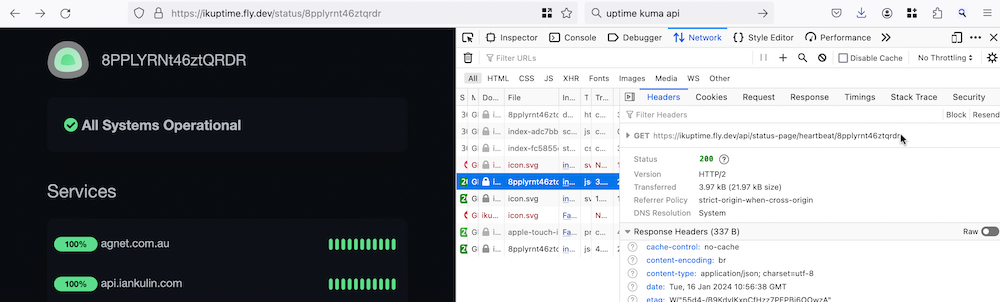
So if you view the status page at <whatever.com>/status/<page_name>, it loads some data from <whatever.com>/api/status-page/heartbeat/<page_name>.
The JSON that’s returned from this request contains two objects: heartbeatlist, and uptimelist.
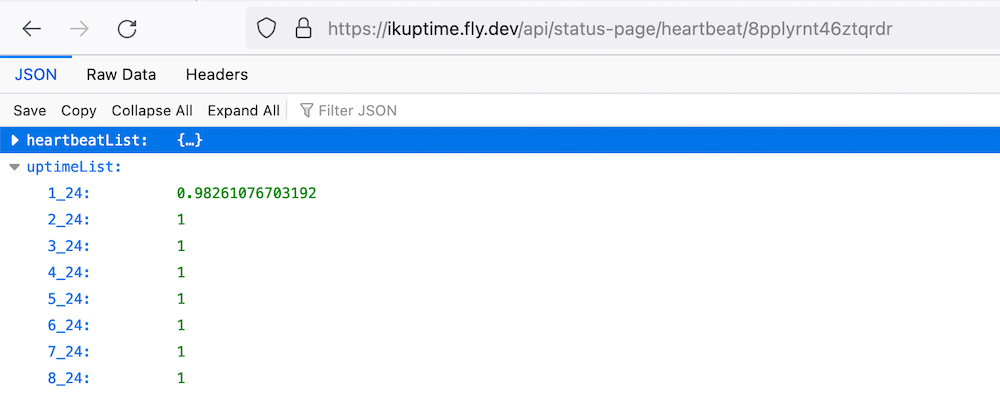
heartbeatlist contains the last 50 retrievals for each of the URL’s being monitored. Each of these retrievals has a status (1 for up, 0 for down) and the response time. uptimelist is the fraction of uptime. You can see in the data above that the first URL has a lower percentage of up-time (because I failed it to check my understanding of the status data).
So I need to write an endpoint that requests this data, then checks the last array element of each of the URLs in the heartbeat list, then spit out some text saying if all the URL’s in this status group are available. That’s quite doable, I have the skills, but it’s probably a two hour job to do properly.
Since this is an open source project, a better use of that time would be to add this functionality to Uptime Kuma so it would be available to anyone with the same problem. It might be a niche case, but the code to provide this output would be simpler inside the project and much more durable than reverse engineering it.
Let’s have a look at the source and see what it’s like.
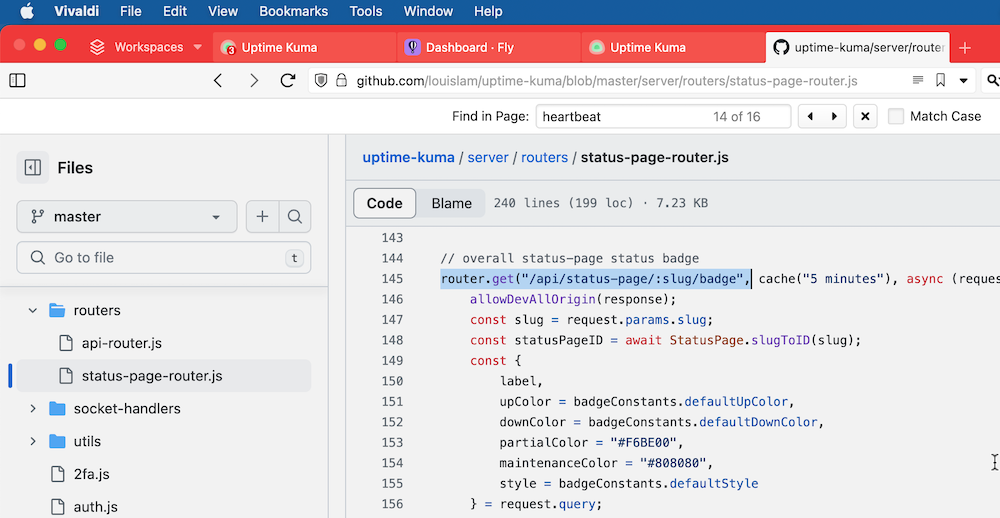
Well, well well. What do we have here? There’s an api route that outputs an SVG badge for a status page. The badge says ‘Degraded’ in amber if some of the URL’s are down, and ‘Up’ in green if they are all up. Those words are present in an aria label and the svg <title> tag, so they’ll be detectable by the Uptime Kuma ‘keyword’ search.
Five minutes later, we’re in business. Thank you open source!