Outside Temperature From an API in a Shell Script
3 May 2023
I’m interested in collecting some internal temperature data from my servers to look at the effect of adding an NMVe drive. Last week we had a couple of warm days immediately followed by a couple of cool ones. I imagine a 20° ambient temperature change could effect the server temperatures, so I thought it would be good to add that to my temperature logs.
I don’t have a weather station or other automated system for collecting the temperature, but there are several commercial sources for this data which, while probably not as good as a sensor in the server room, will be fine for our purposes.
One of the more well known weather APIs was Dark Sky , they got bought up by Apple and now similar data is available in the WeatherKit API . I hold a developer program membership, so that would be free to use for the frequency I need, but the API and sign up looked a bit complex, so I looked elsewhere.
OpenWeather have a simple API (including one intended to make changing over from Dark Sky easy), a good free tier , and simple sign up - no credit card required. On the free tier I can pull the current weather for a location 22 times a minute continuously. Since I’m only collecting my server temps on a five minute cycle, that will be more than fine.
Even thought the API would allow it, it seems wasteful, and greedy (since I’m not paying for it), to pull the same data three times (for each of the three servers), so to complicate things (and learn some interesting stuff) I decided to poll the OpenWeather API once every five minutes from my VPS, process that current weather JSON down to just the temperature I was after, then expose that as a http endpoint. Then each of my servers would poll the VPS to get that outside temp as part of their logging.

This will all extend involve some scripting that I haven’t encountered yet.
VPS / Weather API
The OpenWeather API couldn’t be more straightforward, you sign up with an email and get an API token, then it’s just this:
https://api.openweathermap.org/data/2.5/weather?lat={lat}&lon={lon}&appid={API key}
There’s a couple of options for language and units, I went with metric, then you get have some JSON.
{
  "coord": {
    "lon": 118,
    "lat": -33.93
  },
  "weather": [
    {
      "id": 803,
      "main": "Clouds",
      "description": "broken clouds",
      "icon": "04d"
    }
  ],
  "base": "stations",
  "main": {
    "temp": 12.59,
    "feels_like": 11.68,
    "temp_min": 12.59,
    "temp_max": 12.59,
    "pressure": 1007,
    "humidity": 68,
    "sea_level": 1007,
    "grnd_level": 976
  },
  "visibility": 10000,
  "wind": {
    "speed": 7.39,
    "deg": 307,
    "gust": 11.23
  },
  "clouds": {
    "all": 64
  },
  "dt": 1682401802,
  "sys": {
    "country": "AU",
    "sunrise": 1682375848,
    "sunset": 1682415263
  },
  "timezone": 28800,
  "id": 2070753,
  "name": "Gnowangerup",
  "cod": 200
}
From this, I want to extract the temperature, and the unix timestamp “dt”. Here’s my bash script.
#!/bin/bash
weather_text=`curl -s "https://api.openweathermap.org/data/2.5/weather?lat=-33.93&lon=118.00&appid=somegiantrandomUIDtypenumber&units=metric"`
temp_text=`echo $weather_text | awk -F'"temp":' '{print $2}' | cut -d',' -f1`
time_text=`echo $weather_text | awk -F'"dt":' '{print $2}' | cut -d',' -f1`
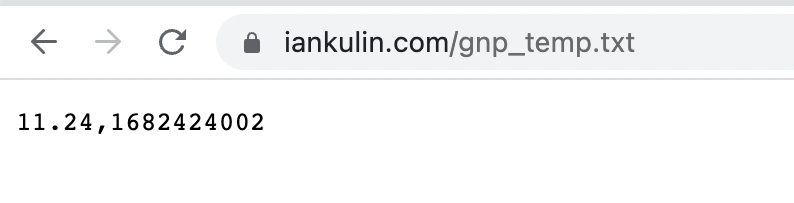
log_file="/home/ian/iankulin.com/www/gnp_temp.txt"
printf "%s,%s" $temp_text $time_text > $log_file
Of note, and that I haven’t already discussed:
weather_text=`curl -s "https://api.openweathermap.org/data/2.5/weather?lat=-33.93&lon=118.00&appid=somegiantrandomUIDtypenumber&units=metric"`
curl basically sends out a network request the same as if you had typed it into the top of your browser. If it was a web page, it would return the text of the HTML, but in this case it returns the JSON I showed before - although less formatted.
weather_text is a variable to which we are assigning the return value of the curl - ie the string of JSON. Note the backticks `` the curl is enclosed in. This is how the script knows to execute the command and assign the results rather than assigning some text beginning with curl.
temp_text=`echo $weather_text | awk -F'"temp":' '{print $2}' | cut -d',' -f1`
Oh man, this took me on a journey. Firstly, keep in mind I’ve prettified the JSON above, actually the string looked like this, so it wasn’t possible to process it on a line by line.
{"coord":{"lon":118,"lat":-33.93},"weather":[{"id":803,"main":"Clouds","description":"broken clouds","icon":"04d"}],"base":"stations","main":{"temp":12.59,"feels_like":11.68,"temp_min":12.59,"temp_max":12.59,"pressure":1007,"humidity":68,"sea_level":1007,"grnd_level":976},"visibility":10000,"wind":{"speed":7.39,"deg":307,"gust":11.23},"clouds":{"all":64},"dt":1682401802,"sys":{"country":"AU","sunrise":1682375848,"sunset":1682415263},"timezone":28800,"id":2070753,"name":"Gnowangerup","cod":200}
We are assigning to the variable temp_text the contents of this command, where $weather_text is the JSON string.
echo $weather_text | awk -F'"temp":' '{print $2}' | cut -d',' -f1
The vertical lines are called pipes | they send the output of the command on their left into the command to their right. So there’s three different things happening here. The echo just outputs the JSON, then we process it twice more.
awk -F'"temp":' '{print $2}'
awk is one of the great text processing commands along with grep and sed. The way it is being used here is to break the string into multiple parts, where the parts are delimited by the text "temp": which in our case is just two parts. Then we are outputting the second part ready for the next processing. So at this stage, the text would look like this.
12.59,"feels_like":11.68,"temp_min":12.59,"temp_max":12.59,"pressure":1007,"humidity":68,"sea_level":1007,"grnd_level":976},"visibility":10000,"wind":{"speed":7.39,"deg":307,"gust":11.23},"clouds":{"all":64},"dt":1682401802,"sys":{"country":"AU","sunrise":1682375848,"sunset":1682415263},"timezone":28800,"id":2070753,"name":"Gnowangerup","cod":200}
Then I need to do the same sort of thing again - split the string using a delimiter, and just keep the part with the termperature in it. This time we’ll use a comma , as the delimiter, and only keep the part in front of it.
cut -d',' -f1
We’re saying cut this string in to bits were the delimiter -d is a comma, then output the first field.
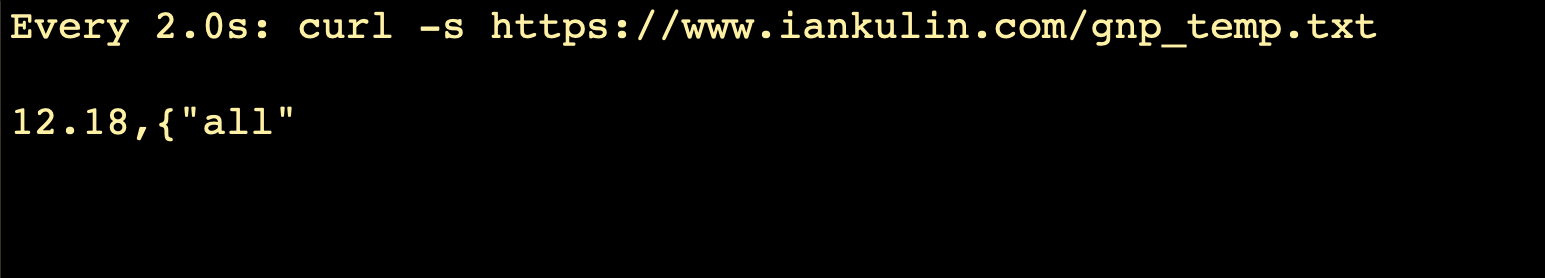
You might be wondering why I didn’t just use awk again - I could have, but cut is simpler. The reason I didn’t use cut both times is that it can only take a single character as a delimiter. In fact, the first version I wrote of this script only used cut, and I had the delimiters as colon for the first cut and comma for the second. As I was writing it, I was thinking that I should stress in the blog post about it that it was quite fragile - a small change in the JSON (for example adding a field, or changing the order - both things that would not cause a problem to a good Swift or JS JSON library) would break it. Then the weather changed and so was two layers of clouds, and the script broke and output the time as {"all" instead of a number.
The printf just outputs the two values - temperature and timestamp as plain text with a comma between them into a text file that’s in the root of the Nginx webserver.
Now that’s in place, I just edited /etc/crontab to have the new script run every five minutes to update the file with the temperature and timestamp.
Server Temp Logging
We’ve already seen most of this, but I’ve made a couple of additions.
#!/bin/bash
#check drivetemp has been loaded - needed for ssd temp
if ! lsmod | grep -wq drivetemp; then
modprobe drivetemp
fi
#collect the temp data
pch_name=`cat /sys/class/hwmon/hwmon0/name`
pch_temp=`cat /sys/class/hwmon/hwmon0/temp1_input`
cpu_name=`cat /sys/class/hwmon/hwmon1/name`
cpu_temp=`cat /sys/class/hwmon/hwmon1/temp1_input`
ssd_name=`cat /sys/class/hwmon/hwmon2/name`
ssd_temp=`cat /sys/class/hwmon/hwmon2/temp1_input`
#this should contain the current outside temp and unix time
outside_temp=`curl -s "https://iankulin.com/gnp_temp.txt"`
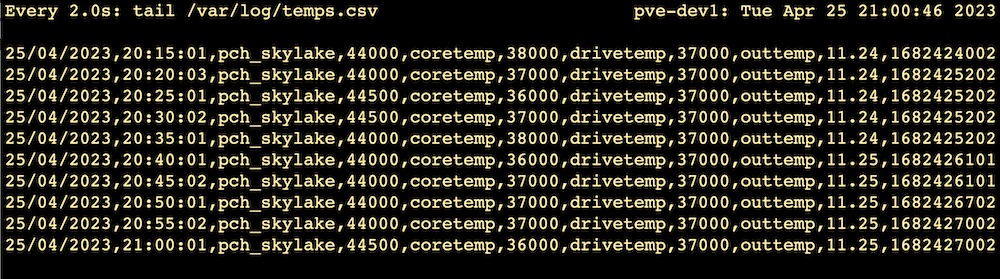
log_file="/var/log/temps.csv"
# Print the temperatures to a log file
printf "$(date +'%d/%m/%Y,%T'),%s,%d,%s,%d,%s,%d,out,%s\n" $pch_name $pch_temp $cpu_name $cpu_temp $ssd_name $ssd_temp $outside_temp >> $log_file
We’ve already discussed how the curl works - this one is picking up the script we wrote to run on the VPS earlier. More interesting is checking for the drivetemp module.
The drivetemp module needs to be loaded into the Linux kernel before we can read the SSD temperature with the line.
ssd_temp=`cat /sys/class/hwmon/hwmon2/temp1_input`
Once it’s loaded, it stays there, unless computer is shutdown for any reason. There’s a number of places we can execute things on startup, but really this drivetemp module is only needed for this script, so we should do it here. As far as I can make out, telling Linux to load a module that’s already loaded does not do any harm, and at once every five minutes it’s hardly going to cause a performance issue. Nevertheless, some sort of programmer ethics compels me to only do it if its needed.
#check drivetemp has been loaded - needed for ssd temp
if ! lsmod | grep -wq drivetemp; then
  modprobe drivetemp
fi
lsmod returns a list of the loaded modules, this is passed to the grep. grep looks through lines of input and usually returns any lines that match. However in this case, we’re using the -q (quiet) option. With this option on, instead of lines of text, you get nothing on the standard output, instead it sets the exit code to 0 (true) if it’s found, or 1 (false) if not.
Since I’m interested in only running the modprobe if drivetemp is not found, I have to negate the result of the grep with !
After that, all the temperature data is collected, then written out to a log fie for later processing.
The Results
Here’s 24 hours of the five minute temperature logs. For each server I averaged the three different temperatures (PCH, CPU core, and SSD drive) and graphed them along with the outside temperature from OpenWeather. pve-prod1 is the only one doing any real work here. It hosts my Jellyfin media server on a VM, and another VM with a collection of utilities such as Uptime Kuma. The Y axis is degrees centigrade.
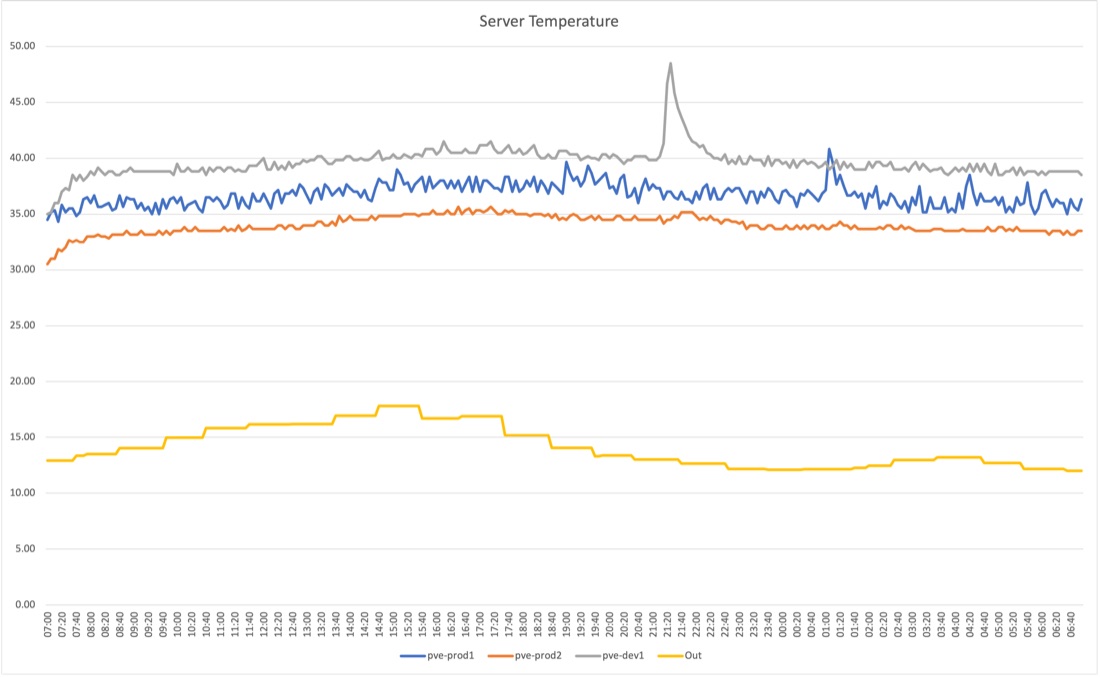

The spike in pve-dev1 at 2100 was caused by me stress testing one core to 100% load for ten minutes. I think I can see pve-prod2 (which sits directly on top of pve-dev1) warming up a little as well. But strangely, and perhaps I’m imagining it, it seems like pve-prod1 (which sits on top of the stack) was a bit cooler in that time?
I don’t remember if I watched some TV between 6 and 8pm, but it looks like I did, and the spike at 2am will be the nightly snapshots being taken and sent off to the NAS.
You can see that pve-prod2 and pve-dev1 were turned on to run this test, and it takes about 40 minutes for them to warm up. It’s interesting to notice the bigger amplitude of the production machine compared to the others just idling. And also interesting that pve-dev1 (which wasn’t running any load till I ran the stress test on it) was just generally warmer that pve-prod1 which was running a small work load.
I don’t remember if I watched some TV between 6 and 8pm, but it looks like I did, and the spike at 2am will be the nightly snapshots being taken and sent off to the NAS.
Let’s have a look at pve-dev1 while the stress test was running.

It makes sense that the PCH which is mm away from, and directly connected to, the CPU would warm up as the CPU was hammered with square root calculations, and since the drive temp is a up a little so I guess that reflects the ambient temperature inside the case.
The CPU temperature hadn’t plateaued yet, so it might be interesting to run it until it does one day and see what that looks like.