Perils of Benchmarking
6 Jan 2025I’ve been containerising my websites, with their servers to make deployment simple and robust, and to move to a CI/CD workflow. Since an install of a production web server is large, I would be running about ten of these containers, and there’s already a good server facing the net and doing the reverse-proxying (NGINX Proxy Manager), I chose to bundle the Busy-Box httpd server with my sites inside the Docker containers.
I had a vague feeling that there was a performance vs size compromise involved, and during some googling found this github repo where nerkn has bench-marked busy-box vs apache vs nginx with, to me (because of my choice above), alarming results.
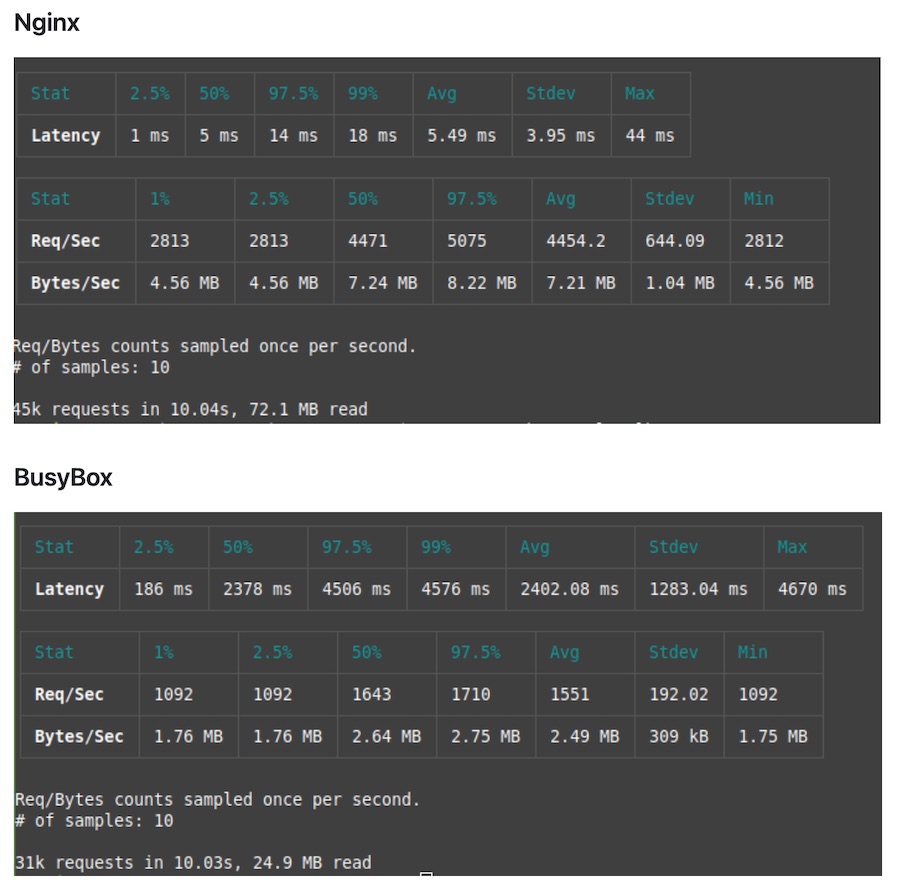
If NGINX is doing twice the throughput, and is two orders of magnitude quicker, then busy-box is not going to be a good choice for me.
Before I panicked, I thought I’d do my own A/B tests, which since it’s containerised is simple. I used the apache ab testing tool - it spits out the basics - times for connecting, processing, and waiting. It does multiple tests and gives you the mean and standard deviation for them. Perfect.
Here’s the results for a series of tests. I included a commercial website I suspect is in the same data centre as a sanity check.
| Test | Mean time (ms) | St dev |
| nextdc.com.au | 834 | 293 |
| busy-box uclibc | 450 | 93 |
| busy-box uclibc | 411 | 24 |
| nginx-alpine | 423 | 24 |
| nginx-alpine | 410 | 26 |
| busy-box uclibc | 398 | 19 |
| busy-box uclibc | 419 | 20 |
| nginx-alpine | 403 | 16 |
| nginx-alpine | 398 | 23 |
| nextdc.com.au | 759 | 306 |
Huh. A couple of things jump out. One is that the site is probably fast enough, and the other is that the performance of busy-box and NGINX are similar, like very suspiciously similar. I wonder what happens if I docker compose down the website and run the test again?….
This is ApacheBench, Version 2.3 <$Revision: 1903618 $>
Copyright 1996 Adam Twiss, Zeus Technology Ltd, http://www.zeustech.net/
Licensed to The Apache Software Foundation, http://www.apache.org/
...
Concurrency Level:      10
Time taken for tests:   4.608 seconds
Complete requests:      100
Failed requests:        0
Non-2xx responses:      100
Total transferred:      30300 bytes
HTML transferred:       15400 bytes
Requests per second:    21.70 [#/sec] (mean)
Time per request:       460.777 [ms] (mean)
Time per request:       46.078 [ms] (mean, across all concurrent requests)
Transfer rate:          6.42 [Kbytes/sec] received

Connection Times (ms)
              min  mean[+/-sd] median   max
Connect:      274  318  33.6    306     451
Processing:    82   95  14.5     92     170
Waiting:       82   95  14.3     92     169
Total:        362  413  37.5    401     580
...
lol. Okay. I guess I’ve been testing the cache in NGINX Proxy Manager this whole time. There is a setting for that, so perhaps I should turn that off. Sadly, even with that turned off, and the container not running, I’m still getting that good performance which would be the 500 error coming back from NGINX Proxy Manager.
Time to trick it into not using the cache by making unique requests each time. I’ll use these:
ab -n 100 -c 10 "https://example.com.au/index.html?nocache=$(date +%s%N)"
ab -n 100 -c 10 "https://www.nextdc.com/index.html?nocache=$(date%20+%s%N)"
I’m also able to see that it’s hitting the container with all the requests by running the compose up in the foreground and having the logs output. So now I’m much more confident about the output. Here’s the summary of a much larger group of tests run in that round robin style.
| Situation | Mean time (ms) |
| Nextdc.com | 617 |
| NGINX Proxy with no site | 412 |
| NGINX-apline site | 420 |
| Busy-box (uclibc) | 424 |
The comparison with nextdc is of course unfair. They are returning a lot more html, and some of it could be server rendered. I don’t have an explanation of why my results are so different from nerkn’s. He’s using a different tool, and I imagine on a local network (mine is over a mobile data link, to a VPS in a data centre).
As far as the container size comparisons go, the NGINX-alpine one is 48.98MB and the uclibc version of BusyBox is 1.35MB. I think I’ll be sticking with that.